Pints and Pantries: The Unconventional Indicators Predicting the UK’s 2026 Economic Future
In the world of finance and economics, we are conditioned to watch a specific set of numbers. We wait with bated breath for the quarterly GDP figures, scrutinize the monthly inflation reports, and analyze unemployment statistics down to the decimal point. These are the traditional pillars of economic analysis, the data points that move the stock market and shape central banking policy. But what if the most telling signs of our economic health aren’t found in a government spreadsheet, but in the queue at a local food bank or the weekend crowd at a neighborhood pub?
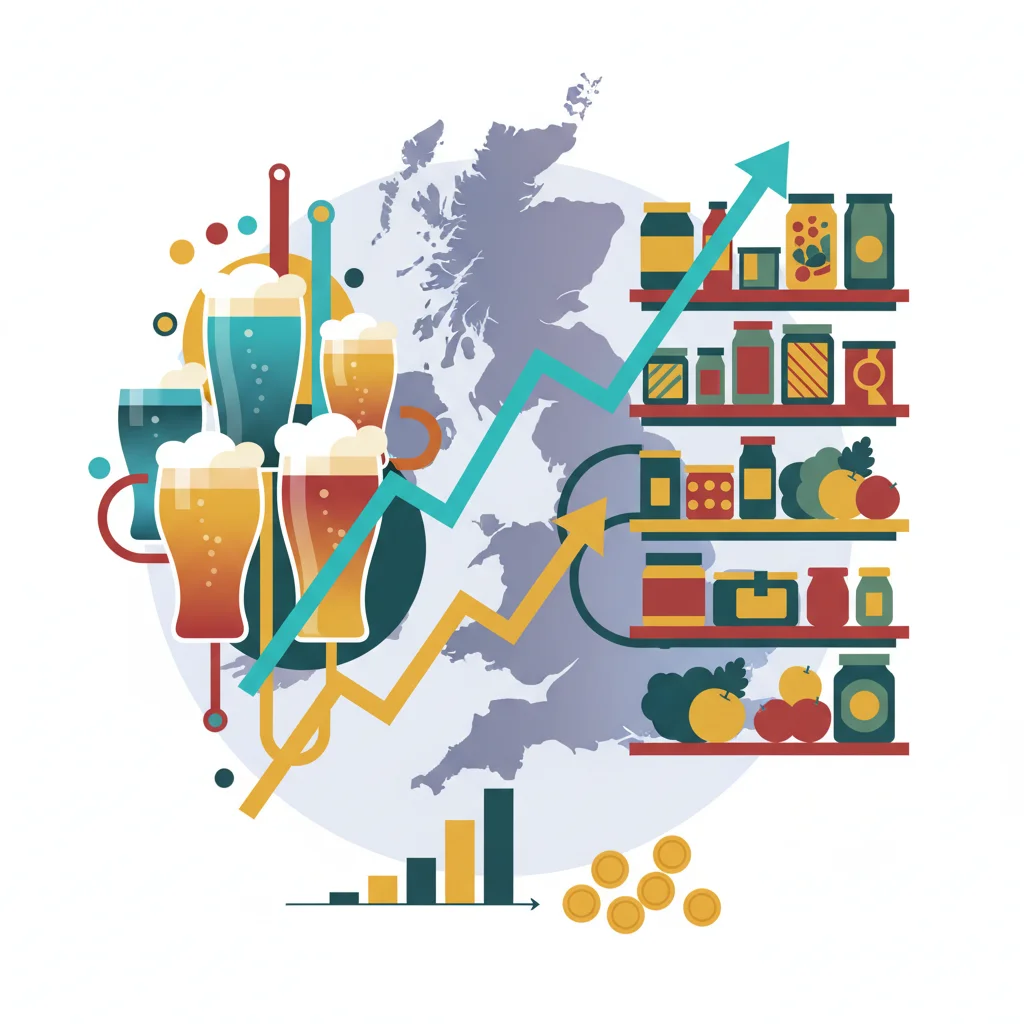
A recent BBC analysis posed a simple yet profound question: will we see growth by 2026? It suggested that the answer lies not just in complex financial models, but in two very human metrics: the demand for food assistance and the fortunes of the hospitality trade. This “on-the-ground” perspective offers a powerful, real-time pulse of the nation’s financial well-being, often revealing truths that official data only confirms months later. For investors, business leaders, and anyone interested in the real economy, understanding these unconventional indicators is no longer a novelty—it’s a necessity.
The Lag and the Abstract: Why Traditional Metrics Fall Short
Before we dive into the significance of food banks and pubs, it’s crucial to understand the limitations of the data we typically rely on. Metrics like Gross Domestic Product (GDP), the Consumer Price Index (CPI), and official employment rates are fundamental to macroeconomics, but they come with inherent drawbacks.
- Lagging Indicators: GDP figures, for example, tell us about the economic activity of the previous quarter. By the time the data is released, the reality on the ground may have already shifted. It’s like trying to drive by looking only in the rearview mirror.
- Averages Hide Disparities: A positive national GDP growth figure can mask severe regional recessions or sector-specific downturns. It doesn’t tell you if the growth is concentrated among the wealthiest or if it’s benefiting the average household.
- Abstract Nature: For most people, a 0.2% rise in GDP is a meaningless statistic. It doesn’t reflect the rising cost of their weekly shop or their ability to afford a family meal out.
This is where the world of investing and trading often seeks an edge. Professional traders and hedge funds spend billions on “alternative data” to get ahead of official reports. They analyze satellite images of retail car parks, track credit card transaction volumes, and monitor shipping movements to build a more immediate picture of economic activity. The “pints and pantries” indicators are, in essence, a publicly accessible form of this alternative data.
The Canary in the Coal Mine: Food Bank Usage as a Distress Signal
The concept of a “canary in the coal mine” refers to an early warning of danger. In modern economics, rising food bank usage is perhaps the most potent canary we have. When a growing number of households cannot afford basic necessities, it signals a deep-seated fragility in the economy that broad-based statistics can obscure.
According to The Trussell Trust, one of the UK’s largest food bank networks, over 3.1 million emergency food parcels were distributed between April 2023 and March 2024, a significant increase from previous years (source). This isn’t just a social issue; it’s a critical economic indicator for several reasons:
- Indicator of Real-Wage Erosion: It demonstrates that for a significant portion of the population, wages are not keeping pace with the cost of living. Even in an economy with low unemployment, if jobs don’t pay enough to cover essentials, consumer spending power is crippled.
- A Precursor to Debt Crises: Households turning to food banks are often one unexpected bill away from defaulting on loans, credit cards, or mortgages. This poses a systemic risk to the banking sector and the broader financial system.
- Impact on Future Consumption: When people are worried about food, all discretionary spending ceases. This has a direct and immediate chilling effect on retail, entertainment, and hospitality sectors, creating a negative feedback loop in the economy.
For an investor, watching food bank demand is a powerful proxy for the health of the consumer base at the lower end of the income spectrum. If this number is rising, it suggests that any consumer-led recovery will be weak and uneven.
The Barometer of Confidence: The Hospitality Sector’s Health
If food bank usage tells us about economic distress, the health of the hospitality trade—pubs, restaurants, and hotels—tells us about economic confidence. This sector is almost entirely fueled by discretionary spending, the money left over after bills and essential groceries are paid for. It’s a barometer for how optimistic people feel about their personal finances.
As the BBC article highlights, the fortunes of this trade are a clear indicator of whether things are getting better or worse. A bustling pub on a Tuesday night or a restaurant with a two-week waiting list for a table signals that consumers feel secure enough in their jobs and finances to spend on non-essentials. Conversely, empty tables and shuttered establishments are a red flag that belts are tightening across the board.
Here are some key metrics within the hospitality sector that act as powerful economic indicators:
| Hospitality Metric | What It Indicates | Implications for the Broader Economy |
|---|---|---|
| Restaurant & Pub Footfall | Consumer confidence and willingness to spend on social activities. | A leading indicator for the wider retail and entertainment sectors. High footfall suggests robust consumer demand. |
| Average Spend Per Head | The level of consumer comfort with spending. Are they ordering appetizers and desserts, or just a main course? | Falling spend per head, even with stable footfall, can signal underlying financial anxiety and a move towards value-conscious consumption. |
| Hotel Occupancy & Booking Rates | Confidence in future finances, impacting both leisure and business travel. | Strong forward bookings are a sign of optimism for both household and corporate finances. It impacts the travel, airline, and events industries. |
| Sector Employment & Vacancies | Business owner confidence in future demand. High vacancies can signal labor shortages or wage pressures. | A bellwether for the service economy’s labor market. It provides insights into wage inflation and operational challenges. |
Data from industry bodies like UKHospitality often provides a more current snapshot of consumer behavior than official retail sales figures, giving a crucial edge to anyone trying to understand the real-time dynamics of the UK economy.
The Ozempic Economy: How Weight-Loss Drugs Are Reshaping Corporate Finance and Productivity
Building a Holistic View: Combining the Old with the New
The goal is not to discard traditional economics in favor of these unconventional indicators. Rather, the most sophisticated analysis comes from synthesizing them. A truly insightful view of the economy requires looking at both the macro data and the micro, human-scale evidence. When these different types of indicators tell a conflicting story, it often reveals a deeper, more nuanced truth about the economy.
Consider the following comparison:
| Indicator Type | Examples | Pros | Cons |
|---|---|---|---|
| Traditional Macro Indicators | GDP, CPI Inflation, Unemployment Rate | Comprehensive, standardized, historically consistent, influences policy. | Lagging, abstract, can hide inequalities and regional disparities. |
| On-the-Ground Indicators | Food bank usage, hospitality footfall, high street vacancies. | Real-time, highly relevant to people’s lives, excellent gauge of consumer sentiment. | Can be anecdotal, harder to quantify nationally, may not capture the full economic picture (e.g., B2B activity). |
Imagine a scenario in 2025 where official GDP figures show modest growth, but food bank usage continues to rise and pubs in lower-income areas are closing. This wouldn’t be a contradiction; it would be a clear signal of a “K-shaped” recovery, where wealth is accumulating at the top while the majority are being left behind. This is a critical insight for long-term investing, as such an economy is inherently less stable and more prone to social and political volatility.
The Future of Economic Analysis: The Role of Technology
The principles behind watching pints and pantries are now being supercharged by financial technology. The fintech revolution has unlocked new ways of gathering and analyzing real-time data on a massive scale. Modern banking and investment firms are increasingly using this data to inform their strategies:
- Transaction Data Analysis: Fintech firms can (anonymously and in aggregate) analyze millions of credit and debit card transactions to see which sectors are growing and which are shrinking, weeks before official data is released.
- Sentiment Analysis: AI tools scan social media, news articles, and forums to gauge public mood about the economy, specific brands, or the stock market.
- Blockchain and Supply Chains: While still emerging, blockchain technology offers the potential for a transparent, real-time ledger of economic activity. Imagine being able to track raw material flows and payments through a supply chain instantly, providing an unparalleled view of industrial health.
This technological evolution in financial services is taking the core idea—understanding the real economy—and applying it with a precision and scale never before possible.
The Tennessee Whiskey Effect: How to Find Exponential Returns in Overlooked Assets
Conclusion: A Clearer Vision for 2026
As we look ahead to 2026, the economic landscape will be defined by more than just interest rate decisions and GDP reports. The true measure of our recovery and prosperity will be reflected in the daily lives of citizens. Will families have the disposable income to enjoy a meal out? Will the demand for emergency food aid subside? These are not just social questions; they are among the most astute economic questions we can ask.
For investors navigating the stock market, for business leaders planning for the future, and for policymakers steering the ship, the message is clear. To truly understand the economy, we must look up from the spreadsheets and observe the world around us. The story of our economic future is being written today in our pubs and our pantries. We just need to know how to read it.